Institutional Effectiveness
Fort Scott Community College (FSCC) measures effectiveness by assessing strengths and gaps in all areas of the college. This information is used to drive improvements and positive change in line with FSCC’s mission and core values. The assessment process targets key areas of the college and requires routine collection of outcome-level data. The data are measured against both institutional and peer benchmarks to determine overall effectiveness.
The evaluation of FSCC’s outcome-level data spans nearly every department, from the President’s Office to the Academic Office to our various committees. It is important for FSCC’s administration, staff, and faculty to be recognized as benefactors in this meticulous effort.
The assessment process is implicitly transparent. Selected information is shared below for the benefit of our stakeholders and consumers.

Sources of the Data
Fort Scott Community Colleges utilizes validated data from IPEDS, NCCBP (National Community College Benchmark Project), Kansas Board of Regents (KHEStats and KSPSD), College Navigator, and the National Student Clearinghouse for public-facing effectiveness reports. Reports using exclusive internal data are validated against all available resources before they are posted, and are indicated in the subtitle of the graph or chart.
Student Success at FSCC
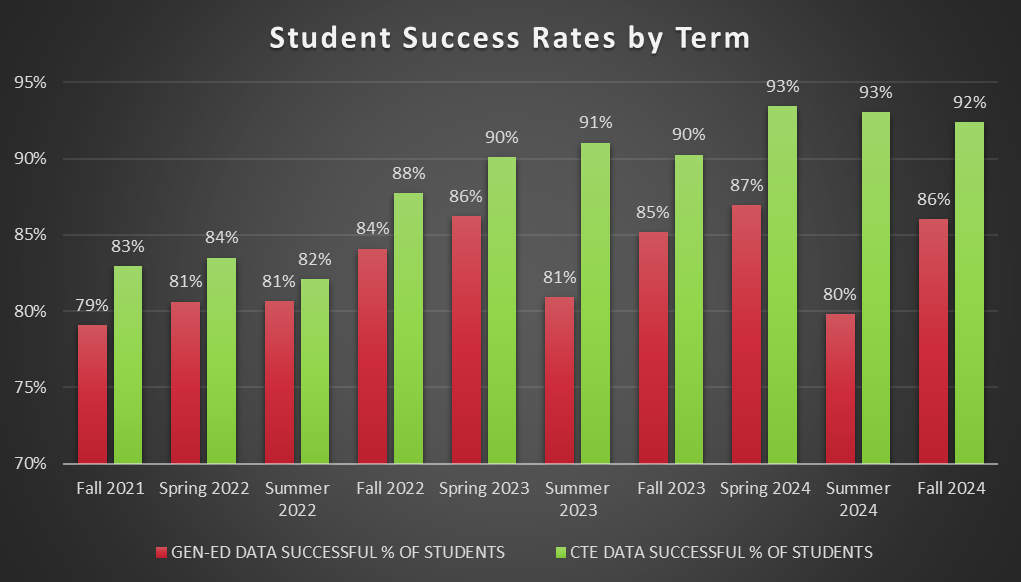
Internal Report. Percent of student registrations earning a passing grade in credit-earning courses.
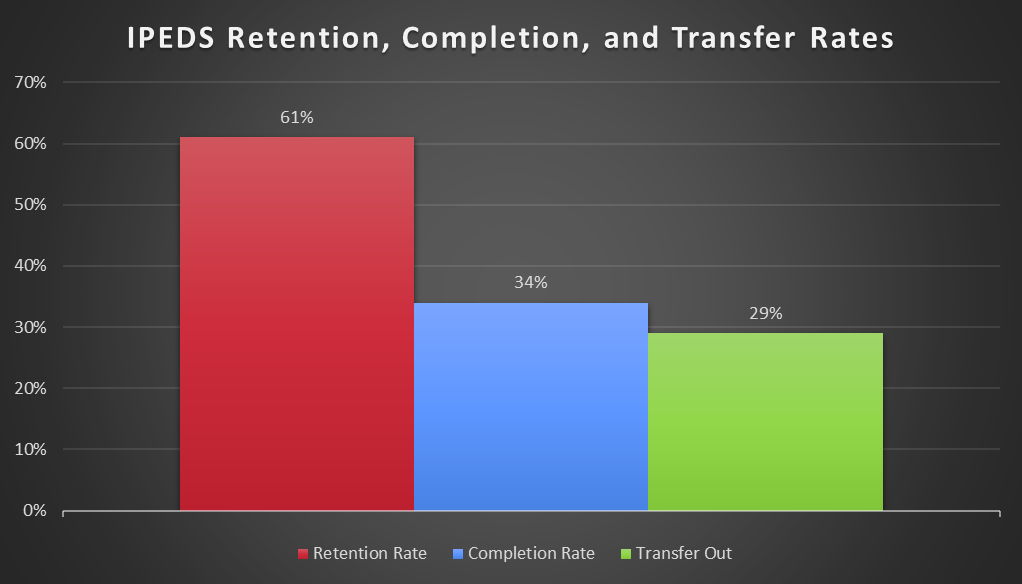
Percentage of students who began their studies in Fall 2022 and returned in Fall 2023.
Percentage of full-time, first-time students who graduated or transferred out within 150% of “normal time” to completion for their program.
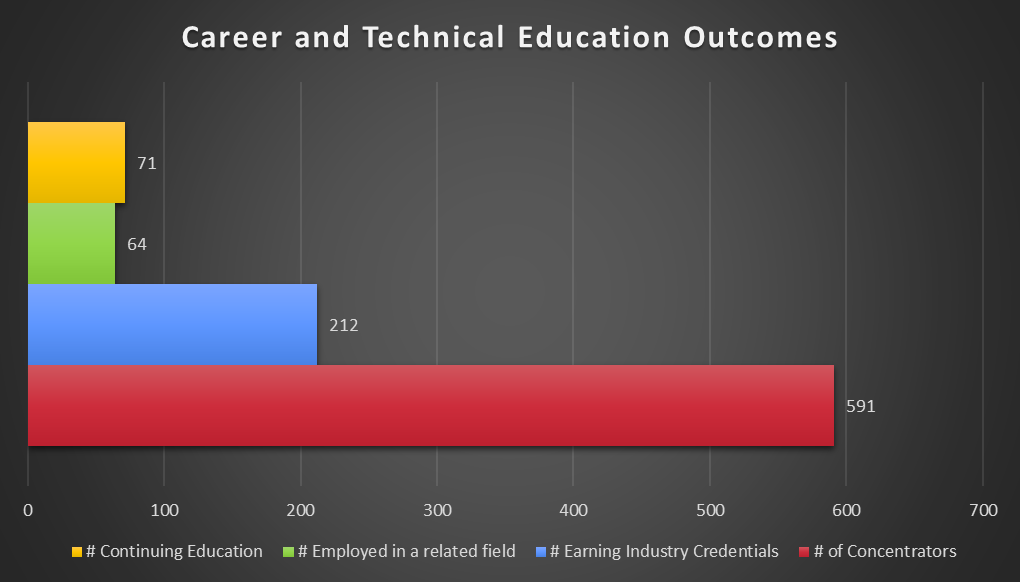
A concentrator is a student earning 12 or more credit hours in a CTE program in an Academic Year. This graph reflects Academic Year 2024.
The above graph was identified to contain erroneous data on 10/06/2025. This error occurred due to a calculation error on an internal report. The correct # Earning Industry Credentials are 361, and the correct # Employed in a related field are 243 (this information was certified in KBOR’s 2024 Follow Up Report). This graph will be updated during the next update cycle for Institutional Effectiveness toward the end of October 2025.
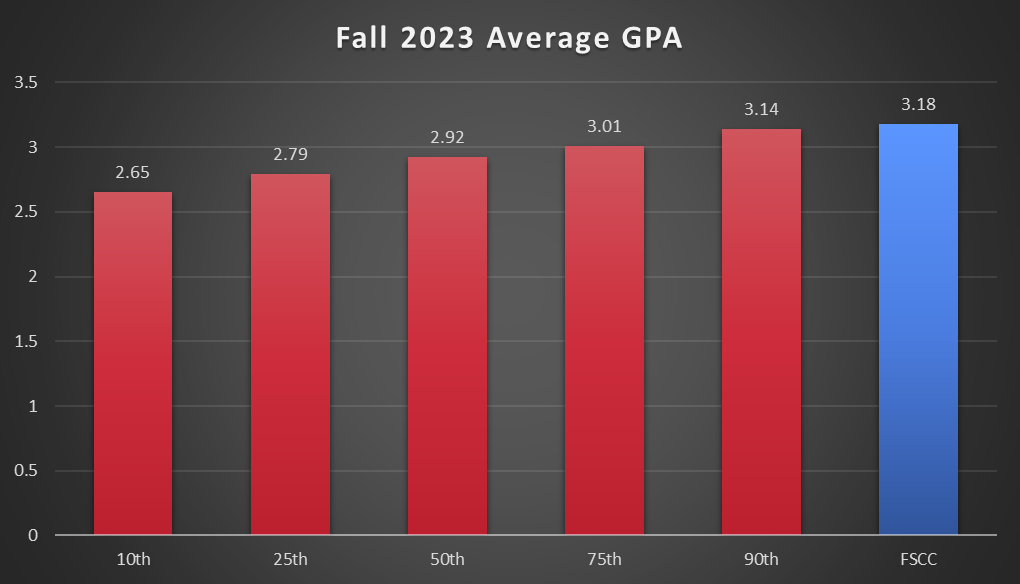
NCCBP Data released in Spring 2024. (GPA) average earned for all students enrolled during Fall 2023.
Transfer Statistics
The following graphs represent FSCC’s students that transferred to 4-year institutions.

KHEStats results of students that transferred from FSCC to 4-Year Institution.
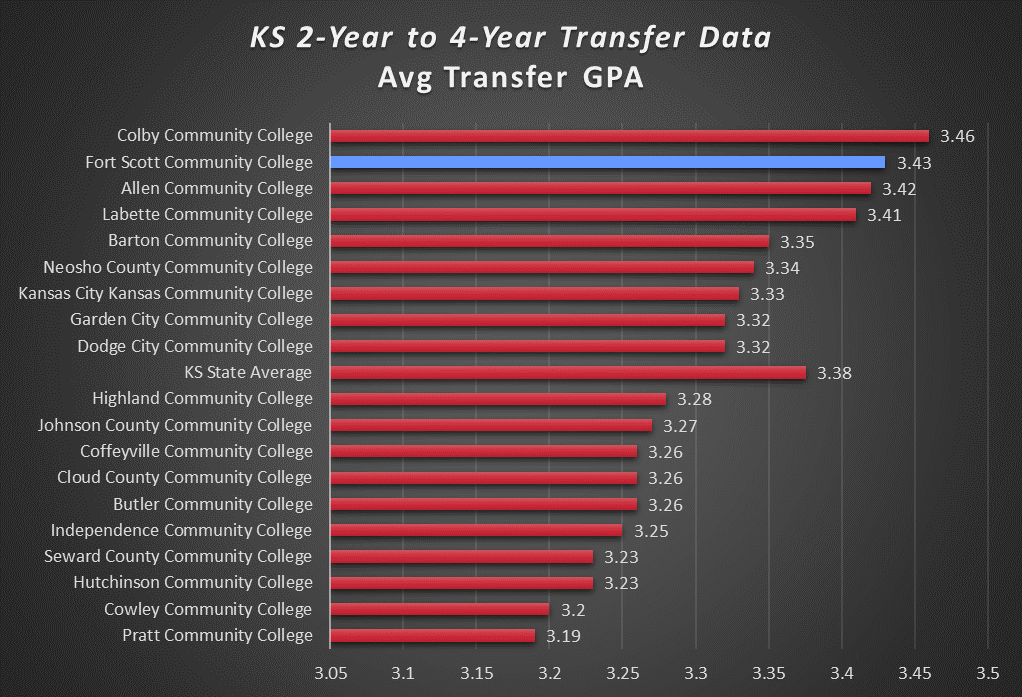
KHEStats results of students that transferred from a KS 2-Year Institution to a KS 4-Year Institution in Fall 2023.
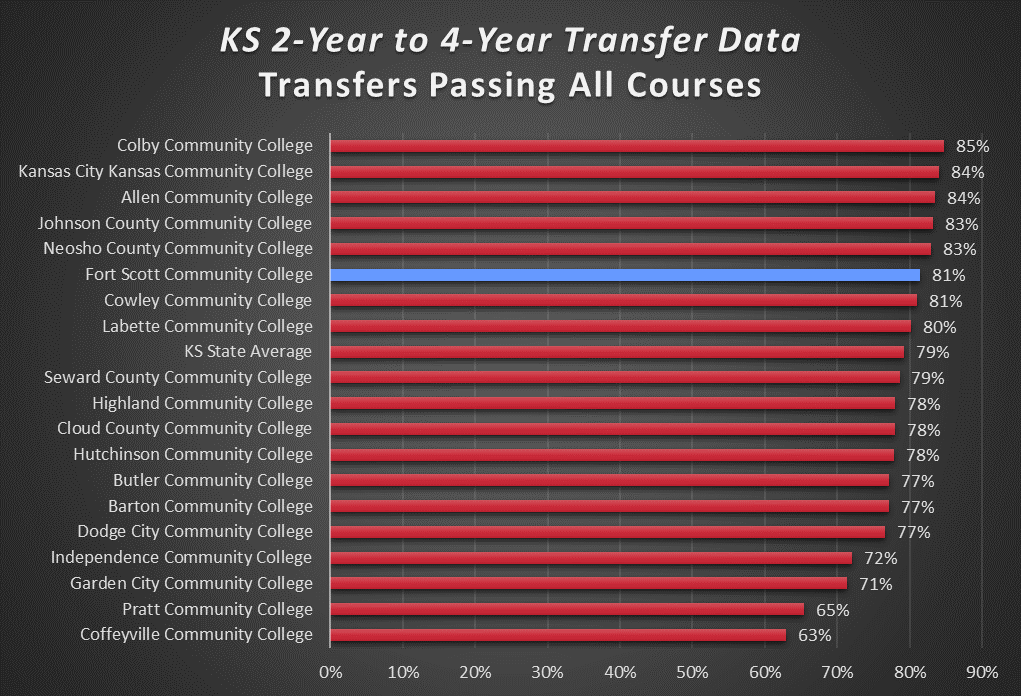
KHEStats results of students that transferred from a KS 2-Year Institution to a KS 4-Year Institution in Fall 2023.
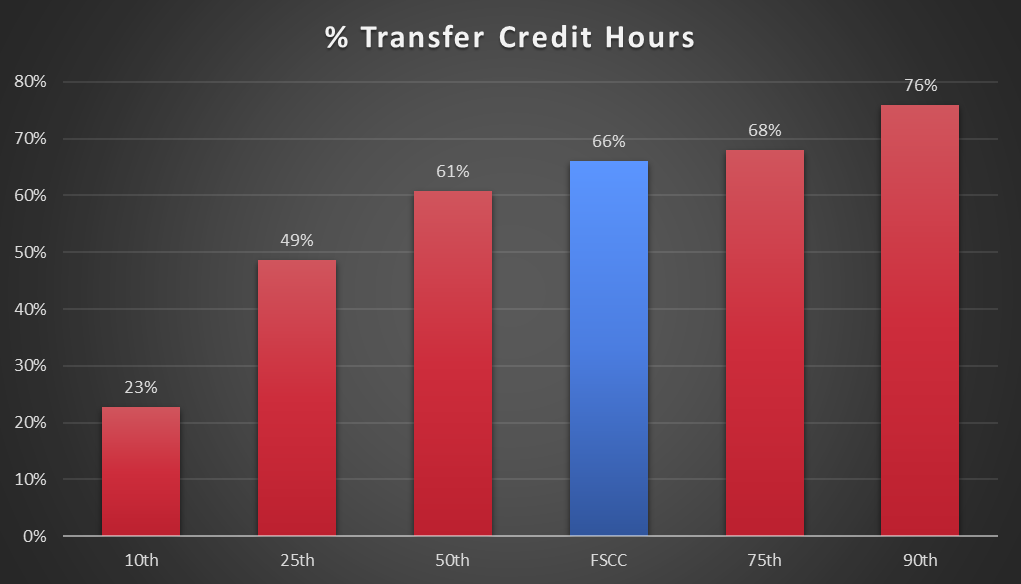
As of Academic Year 2024, the percent of IPEDS Fall Enrollment credit hours in FSCC courses that do not award career or technical certification, but do award credit that is transferable to other postsecondary institutions.
The percentiles in this graph represent all 2-year colleges in the nation, based on NCCBP (National Community College Benchmark Project) data.
College Demographics
Below are graphs representing demographic information about FSCC.

NCCBP Data released in Spring 2024. The percentiles in this graph represent all 2-year colleges in the nation, based on NCCBP data.

NCCBP Data released in Spring 2024. The percentiles in this graph represent all 2-year colleges in the nation, based on NCCBP data.

NCCBP Data released in Spring 2024. The percentiles in this graph represent all 2-year colleges in the nation, based on NCCBP data.
Further analyses of FSCC’s Assessment Data can be found on the Assessment Page.